Midpoints and their generalizations
In what follows, do not worry about the Mathematica code that I used to generate the pictures (it's the bold-faced stuff below that looks extra weird!), but if you are interested, this software is available for your use in several of the campus labs (the University-wide Lab on the 2nd floor of the TC and the Math Lab in Bronson Hall 404 are the ones I know for certain).
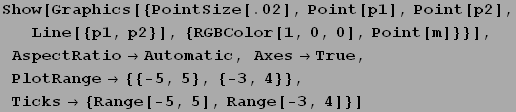
Shown below are two points, ![]() = (-2, 3) and
= (-2, 3) and ![]() =(4,-2), along with the line segment
=(4,-2), along with the line segment ![]() joining them.
joining them.
In[1]:=
![]()
![Show[Graphics[{PointSize[.02], Point[p1], Point[p2], Line[{p1, p2}]}], AspectRatio→Automatic, Axes→True, PlotRange→ {{-5, 5}, {-3, 4}}]](HTMLFiles/index_5.gif)
![[Graphics:HTMLFiles/index_6.gif]](HTMLFiles/index_6.gif)
Out[2]=
![]()
We know how to compute the midpoint of two points ![]() =(
=(![]() ,
, ![]() ) and
) and ![]() =(
=(![]() ,
,![]() ) using the formula
) using the formula
(![]() ,
,![]() ). (M)
). (M)
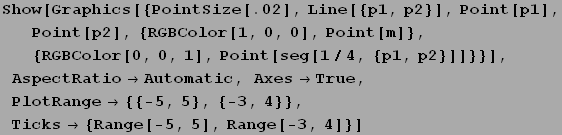
We note that the coordinates of the midpoint are the averages of the corresponding coordinates of the original points. In the example above, the midpoint is easily computed to be the point (1,![]() ). It is shown below in red.
). It is shown below in red.
In[3]:=
![]()
Out[3]=
![]()
In[4]:=
![[Graphics:HTMLFiles/index_20.gif]](HTMLFiles/index_20.gif)
Out[4]=
![]()
We can think of the midpoint as the "average point" and it is nice to write the midpoint of two points ![]() and
and ![]() as
as
![]() ,
,
where the "addition of points" is understood to be done component-wise, as in the formula (M). (Notice how the software accepts this in the calculation above of m=(p1+p2)/2.)
We can also think of it in the following, natural way: The midpoint is the point arrived at if we "start" at the point ![]() and "add one-half the difference between
and "add one-half the difference between ![]() and
and ![]() ". Algebraically, we are saying that our midpoint is the point given by
". Algebraically, we are saying that our midpoint is the point given by
![]() +
+ ![]() (
(![]() -
-![]() )
)
and if we simplify the above expression, we see that we get the same thing:
![]()
=
![]()
=
![]()
=
![]()
=
![]()
When looked at this way, we can similarly locate points at other fractional distances. For example, the point that lies one-third the way from ![]() to
to ![]() should be given by
should be given by
![]() +
+ ![]() (
(![]() -
-![]() )
)
We can program Mathematica to do all of this (and it will save a lot of typing). I'll define the point that lies the fraction t of the way between two points P and Q to be
P + t (Q-P),
where t is 1/2 or 1/3 or whatever. I'll call the function "seg" because it gives be points along the line segment joining the two points.
In[5]:=
![]()
Our original midpoint can be calculated using this function:
In[6]:=
![]()
Out[6]=
![]()
Let's calculate the "one-fourth point". (You should check it by hand.)
In[7]:=
![]()
Out[7]=
![]()
Here it is, in blue, with the two original points.
In[8]:=
![[Graphics:HTMLFiles/index_49.gif]](HTMLFiles/index_49.gif)
Out[8]=
![]()
If you want to get fancy, here are the points at the fractional distances 0,1/20, 2/20, 3/20, ... 19/20,1. And with different colors, too, which are calculated using the same ideas.
In[9]:=
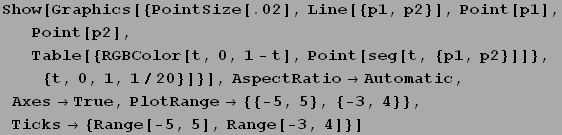
![[Graphics:HTMLFiles/index_52.gif]](HTMLFiles/index_52.gif)
Out[9]=
![]()
Well, I'm getting carried away. But I'm not finished! I want to look at these calculations in that alternate way we used for the midpoint. Here is the case t=3/7:
![]()
=
![]()
=
![]()
=
![]()
There are interesting ways to look at this. One is that of a "weighted average". We rewrite the last expression as
![]()
So here we have the average of the "seven" points, ![]() (counted 4 times) and
(counted 4 times) and ![]() (counted 3 times).
(counted 3 times).
Another way to see it is in terms of the fractions. The point here, ![]()
![]() +
+ ![]()
![]() , can be thought of, fairly literally, as being part
, can be thought of, fairly literally, as being part ![]() and part
and part ![]() , the "parts" being the fractions 4/7 and 3/7, respectively. Note that these two fractions add to the whole, or 1. This is the case for all values of t :
, the "parts" being the fractions 4/7 and 3/7, respectively. Note that these two fractions add to the whole, or 1. This is the case for all values of t :
![]() + t (
+ t (![]() -
-![]() ) = (1-t)
) = (1-t)![]() + t
+ t ![]() .
.
Clearly, the "parts" 1-t and t add to 1, no matter what the value of t. Such a sum is sometimes called a "weighted sum". (Note that t need not be a rational number and that for an arbitrary real value it doesn't necessarily make sense to consider the weighted sum to be a weighted average.)
Question: what do you get if t=0? What if t=1? Does that make sense? (I'll answer that last part: Yes.)
On graph paper, try the values 1/3 and 2/3, for the same points above or make up some others.
It is also interesting to consider what happens if you let t take on some values that are not between 0 and 1. Shown below are the points corresponding to the values t=-0.4 and t=1.15 (in green), using the same points ![]() and
and ![]() .
.
In[10]:=
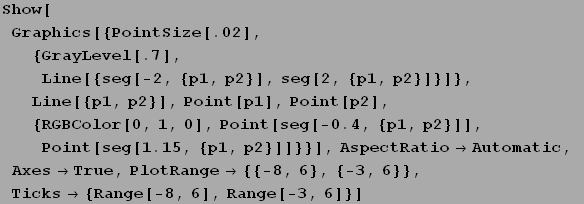
![[Graphics:HTMLFiles/index_75.gif]](HTMLFiles/index_75.gif)
Out[10]=
![]()
Let's also notice that we can generate the entire line segment ![]() , the set of all points inclusively between
, the set of all points inclusively between ![]() and
and ![]() , by letting t range through all values in the closed interval [0,1]. That is,
, by letting t range through all values in the closed interval [0,1]. That is,
![]() = { (1-t)
= { (1-t)![]() +t
+t ![]() | 0≤t≤1}.
| 0≤t≤1}.
Likewise, we can represent the ray emanating from ![]() and passing through
and passing through ![]() by letting t take all nonnegative real values.
by letting t take all nonnegative real values.
![]() = { (1-t)
= { (1-t)![]() +t
+t ![]() | t≥0}.
| t≥0}.
The entire line passing through ![]() and
and ![]() is given by letting t take all real values.
is given by letting t take all real values.
![]() = { (1-t)
= { (1-t)![]() +t
+t ![]() | t∈R}.
| t∈R}.
These kinds of constructions are called parameterizations of the segment, the ray and the line (the "parameter" being the value t ).
One last thought, for now. Above, the line segment joining ![]() and
and ![]() , is given by
, is given by ![]() = { (1-t)
= { (1-t)![]() +t
+t ![]() | 0≤t≤1}, but it could also be expressed as
| 0≤t≤1}, but it could also be expressed as
![]() = { s
= { s ![]() + t
+ t ![]() | s≥0, t≥0, s+t=1}.
| s≥0, t≥0, s+t=1}.
Think about this for a moment. It just says the same thing as before in a different way (that does look more complicated). A point on the segment is the sum of "a part of ![]() " and "a part of
" and "a part of ![]() " where the "parts" are positive numbers whose sum is 1. Why write it this way? Well, it turns out that more points can be brought into the picture. See if you can figure out what the following represents. The picture that follows it gives a hint.
" where the "parts" are positive numbers whose sum is 1. Why write it this way? Well, it turns out that more points can be brought into the picture. See if you can figure out what the following represents. The picture that follows it gives a hint.
{ r ![]() + s
+ s ![]() + t
+ t ![]() | r≥0, s≥0, t≥0, r+s+t=1}.
| r≥0, s≥0, t≥0, r+s+t=1}.
In[11]:=
![]()
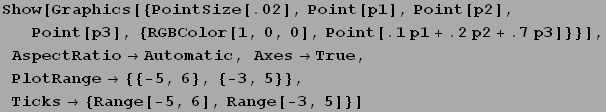
![[Graphics:HTMLFiles/index_108.gif]](HTMLFiles/index_108.gif)
Out[12]=
![]()
Try it yourself using graph paper. You can use the points above, ![]() = (-2, 3),
= (-2, 3), ![]() =(4,-2) and
=(4,-2) and ![]() =(5,4) or pick your own. Plot these points and then plot the points r
=(5,4) or pick your own. Plot these points and then plot the points r ![]() + s
+ s ![]() + t
+ t ![]() for various values of r,s,t such that these are positive and sum to 1. In the picture above I used r=.1, s=.2,t=.7, which yields the (red) point given below.
for various values of r,s,t such that these are positive and sum to 1. In the picture above I used r=.1, s=.2,t=.7, which yields the (red) point given below.
![]()
=
.1(-2,3) + .2(4,-2) + .7(5,4)
=
(-.2,.3) + (.8,-.4) + (3.5,2.8)
=
(-.2+.8+3.5, .3-.4+2.8)
=
(4.1, 2.7).
You can try, for example,
r=1/3, s=1/3, t=1/3
r=1/2, s=1/2, t=0
r=.2, s=.7, t=.1
r=.35, s=.25, t=.40
Let me know how it goes.
| Created by Mathematica (November 13, 2005) |